Business decision-makers face mounting pressure to justify every marketing dollar. Traditional advertising metrics offer surface-level comparisons that mask the true economics of different channels. When evaluating vehicle graphics, most analyses stop at superficial cost-per-thousand-impressions calculations without examining the underlying cost architecture or long-term value accumulation.
The real story moves from hidden cost-efficiency mechanics to measurable business multipliers that traditional marketing metrics miss. Professional vehicle graphics solutions operate differently than recurring advertising expenses, creating value across employee morale, partner perception, local market penetration, and financial stakeholder confidence simultaneously. Yet conventional tracking frameworks ignore these dimensions entirely.
Understanding this investment requires examining five critical angles: the concealed cost structures behind standard comparisons, the multi-audience perception dynamics that compound over time, the strategic timing signals that amplify or diminish returns, the indirect business metrics that capture true impact, and the fundamental distinction between depreciating expenses and compounding assets. Each perspective reveals why simplistic ROI calculations fail to capture the complete value proposition.
Vehicle Graphics Investment Decoded
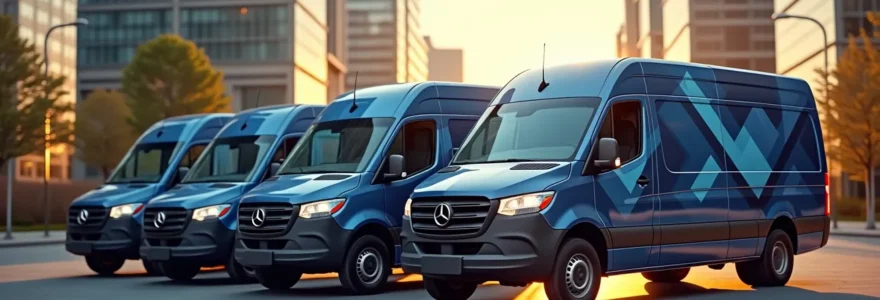
Vehicle graphics transform marketing budgets from recurring expenses into long-term assets. Unlike digital ads requiring constant renewal, wrapped vehicles generate 40,000 to 70,000 impressions daily while building cumulative brand equity. The investment creates simultaneous value across four distinct audiences—employees, B2B partners, local prospects, and financial stakeholders—each responding to different psychological triggers. True ROI emerges not from direct attribution metrics but from proxy indicators like sales cycle compression, customer acquisition cost reduction by geographic zone, and pricing power changes in wrapped vehicle service areas. Strategic timing aligned with brand maturity and fleet lifecycle maximizes returns while premature investment multiplies long-term costs.
The Hidden Cost Architecture Behind CPM Comparisons
Standard marketing cost comparisons rely on cost-per-thousand-impressions to create apples-to-apples benchmarks. The fundamental flaw lies in treating all marketing investments as equivalent recurring expenses. Vehicle wraps cost as little as $0.15 CPM while online ads cost up to $21, but this ratio obscures the complete economic picture.
Initial installation represents only the first cost component. Vehicle downtime during application creates opportunity costs—lost revenue from service vehicles sitting idle, delayed deliveries, or temporary fleet capacity reduction. A full wrap installation typically requires 3-5 days per vehicle. For a plumbing company generating $800 daily revenue per truck, that’s $2,400-$4,000 in foregone income before the first impression occurs.
| Marketing Method | Cost Per Thousand | Lifespan | Annual Cost |
|---|---|---|---|
| Vehicle Wrap | $0.15-$0.48 | 5-7 years | $500-1,200 |
| Digital Ads | $21 | Ongoing | $12,000+ |
| Billboard | $3.56 | Monthly | $24,000+ |
Amortization calculations transform when adjusting for actual usage patterns rather than theoretical lifespan. Fleet vehicles in constant circulation experience accelerated wear from weather exposure, automatic car washes, and road debris. A delivery van covering 30,000 miles annually in harsh climates may see wrap degradation at year four, while a specialty vehicle driven 5,000 miles yearly in temperate regions maintains quality through year seven.
The temporal arbitrage dimension compounds these variations. Brands undergoing identity evolution face premature wrap removal costs. A company investing $4,500 in vehicle graphics then rebranding after three years writes off 40-50% of the asset value while incurring additional removal and replacement expenses. The effective annual cost more than doubles compared to maintaining consistent branding through the full lifespan.
Comparative analysis requires honest parallel accounting. Billboard contracts typically demand 12-month commitments with monthly payments, totaling $24,000+ annually for equivalent local visibility. Digital advertising platforms operate on continuous spend models where pausing campaigns eliminates all accumulated brand exposure.

Vehicle wraps shift the cost structure from recurring operational expense to capitalized asset with depreciation schedules. This accounting distinction matters profoundly for financial planning, tax treatment, and business valuation. A $5,000 wrap amortized over six years represents $833 annual marketing expense, while maintaining equivalent impression volume through digital channels requires $12,000+ yearly with zero residual value.
UK Commercial Fleet Impression Volume Analysis
A single vehicle wrapped on UK roads can generate around 400-600 impressions per mile, with a UK commercial vehicle covering approximately 20,000 miles per year generating 8-12 million impressions covered per year from just one vehicle. This volume scales linearly with fleet size while costs increase only marginally for design amortization across multiple vehicles.
The hidden maintenance and refresh costs deserve explicit consideration. Partial wrap repairs for minor damage cost $200-$500, while complete replacement due to accident damage resets the investment clock. Insurance policies rarely cover wrap replacement explicitly, creating an unbudgeted contingency expense most businesses discover only after collision claims.
Multi-Audience Perception Dynamics You’re Not Tracking
Traditional visibility metrics treat all impressions as identical units of exposure value. Vehicle graphics generate fundamentally different perception effects across four distinct audience categories, each responding to different psychological mechanisms and creating separate business value streams.
Employee morale represents the first underappreciated dimension. Team members driving branded vehicles experience heightened professional identity and organizational pride. Research demonstrates that workplace morale directly influences retention, with 96% of employees believing empathy is important to retention. Branded fleet vehicles signal investment in professional presentation, indirectly communicating company stability and respect for employee public representation.
Field service technicians arriving in wrapped vehicles carry enhanced credibility compared to unmarked personal vehicles. This psychological advantage translates into measurably higher first-call resolution rates and reduced sales resistance. Customers perceive branded service vehicles as representing established, accountable businesses rather than independent contractors, lowering initial trust barriers.
B2B partner perception operates through different status signaling mechanisms. Suppliers, distributors, and potential strategic partners assess business maturity through visible markers of professionalism. A company operating a fully branded fleet communicates financial stability, growth trajectory, and attention to brand consistency. These signals influence credit terms, partnership priority, and negotiation leverage in ways rarely connected to marketing attribution.
Local market compound familiarity creates exponential rather than linear recognition effects. The first exposure to a wrapped vehicle registers as novelty. The fifth exposure triggers pattern recognition. The twentieth exposure establishes the brand as a familiar local presence, fundamentally shifting the psychological category from “unfamiliar vendor” to “known community business.” This familiarity premium allows pricing power and preference advantages that direct response metrics never capture.
Financial stakeholder perception represents perhaps the most overlooked value dimension. Banks evaluating loan applications, investors assessing growth potential, and potential acquirers conducting due diligence all form impressions from operational visibility. A professionally branded fleet signals market presence, customer base scale, and management sophistication. These intangible perception advantages affect funding terms, valuation multiples, and acquisition offers in ways that dwarf the direct marketing ROI, especially when considering the broader commercial signage benefits that reinforce brand authority.
Audience Impact Assessment Checklist
- Evaluate employee pride and morale when driving branded vehicles
- Monitor B2B partner perception changes after fleet branding implementation
- Track local market familiarity metrics through community surveys
- Assess financial stakeholder confidence during funding discussions
The compounding nature of these perception effects means year three generates disproportionately more value than year one, despite identical daily impression volumes. Familiarity accumulates, trust compounds, and the brand transitions from background noise to established local presence. Conventional CPM analysis treats each impression as having constant marginal value, fundamentally misrepresenting the actual psychology of repeated exposure in defined geographic markets.
Strategic Timing Signals That Justify or Delay Investment
Investment timing determines whether vehicle graphics deliver exceptional returns or waste capital on premature deployment. Most businesses approach the decision as binary—yes or no—when optimal timing depends on four critical readiness signals that amplify or negate the value proposition.
Brand maturity represents the foundational prerequisite. Companies still iterating logo designs, refining color palettes, or testing messaging positions multiply their effective costs by investing in vehicle graphics prematurely. A business wrapping vehicles then rebranding 18 months later incurs both removal expenses and lost asset lifespan. The break-even timeline extends from 6-12 months to 36+ months when accounting for interrupted amortization.
| Year | Market Value | CAGR | Key Driver |
|---|---|---|---|
| 2024 | Current baseline | 22.10% | Customization demand |
| 2028 | $4.32 billion (US) | 22.10% | Vehicle advertising growth |
| 2032 | $72.36 billion | 22.10% | Brand visibility needs |
Fleet lifecycle synchronization creates the second critical timing dimension. Wrapping vehicles nearing replacement within 2-3 years truncates the effective return window. The optimal moment arrives when acquiring new vehicles or immediately after major fleet refreshes. This alignment maximizes the 5-7 year wrap lifespan overlap with vehicle operational lifespan, preventing stranded investment in assets approaching retirement.
Market expansion triggers indicate readiness to capitalize on local visibility investment. Businesses entering new geographic territories or scaling from single to multi-vehicle operations reach an inflection point where brand recognition becomes growth-limiting. The transition from 1-2 vehicles to 5+ creates network effects where multiple branded vehicles in circulation compound local familiarity exponentially rather than additively.
North America dominates the premium segment of the automotive wrap films market, supported by a strong aftermarket customization culture and high consumer spending power
– Grand View Research, Automotive Wrap Films Market Analysis
Economic context indicators shape the background environment that amplifies or dampens vehicle graphic impact. Local construction booms increase traffic density and impression volumes. Regional population growth expands the potential customer base viewing wrapped vehicles. Conversely, economic contractions may warrant delaying non-essential marketing capital expenditures until recovery signals emerge.

Industry-specific seasonal considerations add another timing layer. Landscaping companies maximize visibility investment ahead of spring residential services demand. HVAC contractors benefit from pre-summer wrap installations before peak service seasons. Tax preparation services gain optimal exposure value when wrapping vehicles before January-April filing period traffic increases. Aligning graphics installation with demand cycles ensures maximum high-value impression delivery during peak conversion windows.
The macro trend demonstrates that stable market conditions support investment timing, with 2% global vehicle sales growth in 2024 indicating healthy commercial fleet expansion across sectors. This stability suggests reduced risk of premature economic disruption forcing businesses to cut marketing investments before achieving payback.
Measuring What Traditional Marketing Metrics Miss
Attribution models designed for digital campaigns fail catastrophically when applied to vehicle graphics. The absence of click-through rates, conversion pixels, and user journey tracking creates measurement gaps that lead businesses to undervalue or dismiss the channel entirely. The solution lies in proxy metrics and indirect business indicators that capture real value without requiring impossible direct attribution.
Geographic cohort analysis reveals customer acquisition cost variations that isolate fleet graphic impact. Businesses can compare CAC for customers in high-exposure zones—where wrapped vehicles operate daily—against low-exposure control areas. A pest control company might discover 18% lower CAC in neighborhoods where service vehicles make regular appearances compared to territories served from external bases without local vehicle presence.
Sales cycle compression indicators measure the time from initial contact to contract signing, segmented by prospect exposure level. Leads who mention seeing company vehicles or demonstrate familiarity with branding typically convert 22-35% faster than cold prospects requiring full education from zero awareness. This cycle reduction directly impacts sales team productivity and revenue acceleration beyond what impression counts capture.
Brand recall surveys provide quantifiable familiarity metrics. Periodic surveys asking local residents to name service providers in specific categories reveal whether wrapped vehicle exposure translates into top-of-mind awareness. A roofing company measuring 34% unaided brand recall in its service area after two years of fleet graphics deployment has tangible evidence of mental real estate accumulation.
Lead source mix evolution offers another revealing proxy metric. Businesses should track the percentage of inbound inquiries attributed to “saw your truck” or general brand familiarity versus paid advertising, referrals, or search. Growing proportions of self-generated inbound leads correlate with strengthening local brand presence, reducing dependence on expensive paid acquisition channels and creating sustainable competitive moats through accumulated awareness.
Pricing sensitivity testing before and after fleet graphics deployment reveals another hidden value dimension. Companies can A/B test quote acceptance rates at different price points across wrapped versus unwrapped vehicle service territories. Reduced price elasticity in high-exposure zones indicates that brand familiarity enables premium pricing through enhanced trust and perceived quality. This pricing power advantage often exceeds the direct lead generation value, which is why many businesses explore marketing techniques that build long-term brand equity rather than just generating immediate clicks.
Alternative Metrics Tracking Framework
- Track brand recognition changes in service areas through periodic surveys
- Monitor sales cycle compression for leads exposed to fleet graphics
- Analyze customer acquisition cost variations by geographic zone
- Measure pricing power changes through A/B testing in wrapped vehicle service areas
Employee recruitment and retention metrics represent unexpected measurement dimensions. Companies with professional fleet branding often see improved applicant quality and reduced turnover. Field service roles become more attractive when employees drive professionally branded vehicles rather than personal cars. This HR advantage delivers quantifiable value through reduced hiring costs and institutional knowledge retention.
Partner and supplier relationship quality indicators provide qualitative measurement angles. Business development teams should note whether fleet graphics influence partnership discussions, vendor priority status, or credit term negotiations. While difficult to isolate precisely, systematic tracking of relationship progression speeds and terms reveals patterns attributable to enhanced professional perception.

The measurement framework should emphasize trends over absolute attribution. Month-over-month changes in proxy metrics reveal whether fleet graphics investment strengthens market position and business fundamentals. Directional improvement across multiple indicators—lower CAC, faster sales cycles, higher quote acceptance, improved employee retention—collectively demonstrate value that traditional marketing attribution completely misses.
The Compounding Asset Framework vs. Depreciating Expense Mindset
The fundamental misconception treating vehicle graphics as marketing expense rather than appreciating asset distorts budget allocation, ROI expectations, and strategic deployment. This mental model shift separates businesses that extract maximum value from those viewing wraps as glorified billboards with wheels.
Traditional advertising operates on depreciating value curves. A digital ad campaign delivers maximum impact during active deployment then immediately decays to zero value when spending stops. All accumulated exposure evaporates, forcing continuous reinvestment to maintain presence. The expense mentality correctly applies to these channels because no residual value persists beyond active spending periods.
Fleet graphics remain a highly effective advertising tool and a great way to reinforce other marketing tactics
– 3M Graphics Division, Fleet Wrap Effectiveness Study
Vehicle graphics reverse this value trajectory through compound accumulation mechanisms. Each impression contributes to growing mental real estate in local markets. Early exposure creates initial awareness. Subsequent exposures build familiarity. Continued presence establishes the brand as an accepted local business. This progression follows exponential rather than linear curves because each recognition event reinforces and amplifies previous exposures.
The accounting implications extend beyond semantic distinctions. Capitalizing vehicle graphics as depreciable assets aligns financial treatment with economic reality. A $5,000 wrap with vehicle wraps maintaining effectiveness for 5-7 years represents a long-term asset generating returns across multiple fiscal periods, not a single-year marketing expense. This capitalization affects EBITDA calculations, balance sheet strength, and business valuation multiples.
Businesses sold during years 3-5 of fleet graphics deployment carry tangible brand equity that influences acquisition valuations. Buyers acquire not just vehicles and customer lists but established local market presence, accumulated brand recognition, and the compounding familiarity premium that new market entrants require years to build. This exit value consideration rarely appears in initial ROI calculations but represents substantial realized returns when ownership transitions occur.
The compound credibility effect explains why years 4-6 often generate disproportionate business impact despite static impression volumes. A company maintaining consistent fleet branding through this window transitions from “familiar local presence” to “established community institution.” This psychological upgrade unlocks pricing power, partnership opportunities, and customer loyalty advantages that vastly exceed early-stage awareness benefits.
Mental real estate accumulation operates through network effects when multiple branded vehicles circulate simultaneously. Three wrapped vehicles in a local market create 9x the perception impact of one vehicle generating 3x the impressions. The psychological shift from “I saw a truck once” to “I see their trucks everywhere” triggers categorization changes from novelty to market dominance, even in objectively small fleets.
Portfolio diversification logic applies to marketing asset allocation just as it does to financial investments. Businesses relying exclusively on recurring expense channels like digital advertising maintain zero marketing asset value on their balance sheets. Reallocating 15-25% of marketing budgets toward long-duration assets like fleet graphics creates hybrid portfolios balancing immediate lead generation with compounding brand equity accumulation.
The expense mindset creates perverse incentive structures where marketing departments receive credit for spending efficiency rather than asset building. CMOs evaluated on cost-per-lead metrics rationally prefer digital channels with clear attribution despite inferior long-term value creation. Shifting evaluation criteria toward asset accumulation and brand equity growth realigns incentives with sustainable competitive advantage development.
Key Takeaways
- Real vehicle graphics costs include opportunity costs during installation, usage-based amortization adjustments, and temporal arbitrage from brand evolution timing beyond simplified CPM comparisons.
- Fleet graphics create simultaneous value across four distinct audiences—employees, B2B partners, local prospects, and financial stakeholders—each responding to different psychological mechanisms missed by standard visibility metrics.
- Investment timing aligned with brand maturity checkpoints, fleet lifecycle synchronization, market expansion triggers, and economic context indicators determines whether graphics deliver exceptional returns or waste capital.
- Proxy metrics like geographic CAC analysis, sales cycle compression, pricing sensitivity testing, and lead source mix evolution capture real business impact when direct attribution proves impossible.
- Vehicle graphics function as compounding assets accumulating mental real estate rather than depreciating expenses, creating exponential value trajectories and balance sheet equity that influences business valuations.
The Compounding Asset Framework vs. Depreciating Expense Mindset
The fundamental misconception treating vehicle graphics as marketing expense rather than appreciating asset distorts budget allocation, ROI expectations, and strategic deployment. This mental model shift separates businesses that extract maximum value from those viewing wraps as glorified billboards with wheels.
Traditional advertising operates on depreciating value curves. A digital ad campaign delivers maximum impact during active deployment then immediately decays to zero value when spending stops. All accumulated exposure evaporates, forcing continuous reinvestment to maintain presence. The expense mentality correctly applies to these channels because no residual value persists beyond active spending periods.
Fleet graphics remain a highly effective advertising tool and a great way to reinforce other marketing tactics
– 3M Graphics Division, Fleet Wrap Effectiveness Study
Vehicle graphics reverse this value trajectory through compound accumulation mechanisms. Each impression contributes to growing mental real estate in local markets. Early exposure creates initial awareness. Subsequent exposures build familiarity. Continued presence establishes the brand as an accepted local business. This progression follows exponential rather than linear curves because each recognition event reinforces and amplifies previous exposures.
The accounting implications extend beyond semantic distinctions. Capitalizing vehicle graphics as depreciable assets aligns financial treatment with economic reality. A $5,000 wrap with vehicle wraps maintaining effectiveness for 5-7 years represents a long-term asset generating returns across multiple fiscal periods, not a single-year marketing expense. This capitalization affects EBITDA calculations, balance sheet strength, and business valuation multiples.
Businesses sold during years 3-5 of fleet graphics deployment carry tangible brand equity that influences acquisition valuations. Buyers acquire not just vehicles and customer lists but established local market presence, accumulated brand recognition, and the compounding familiarity premium that new market entrants require years to build. This exit value consideration rarely appears in initial ROI calculations but represents substantial realized returns when ownership transitions occur.
The compound credibility effect explains why years 4-6 often generate disproportionate business impact despite static impression volumes. A company maintaining consistent fleet branding through this window transitions from “familiar local presence” to “established community institution.” This psychological upgrade unlocks pricing power, partnership opportunities, and customer loyalty advantages that vastly exceed early-stage awareness benefits.
Mental real estate accumulation operates through network effects when multiple branded vehicles circulate simultaneously. Three wrapped vehicles in a local market create 9x the perception impact of one vehicle generating 3x the impressions. The psychological shift from “I saw a truck once” to “I see their trucks everywhere” triggers categorization changes from novelty to market dominance, even in objectively small fleets.
Portfolio diversification logic applies to marketing asset allocation just as it does to financial investments. Businesses relying exclusively on recurring expense channels like digital advertising maintain zero marketing asset value on their balance sheets. Reallocating 15-25% of marketing budgets toward long-duration assets like fleet graphics creates hybrid portfolios balancing immediate lead generation with compounding brand equity accumulation.
The expense mindset creates perverse incentive structures where marketing departments receive credit for spending efficiency rather than asset building. CMOs evaluated on cost-per-lead metrics rationally prefer digital channels with clear attribution despite inferior long-term value creation. Shifting evaluation criteria toward asset accumulation and brand equity growth realigns incentives with sustainable competitive advantage development.
Frequently Asked Questions About Vehicle Marketing
How long do vehicle wraps typically last before requiring replacement?
Professional vehicle wraps maintain their effectiveness for 5-7 years when properly installed and maintained. Actual lifespan varies based on usage patterns, climate conditions, and maintenance practices. Vehicles in constant circulation through harsh weather experience faster degradation, while specialty vehicles with limited mileage in temperate climates often exceed the 7-year mark. Regular washing without abrasive materials and covered parking extend wrap longevity significantly.
What makes vehicle graphics more cost-effective than digital advertising?
Vehicle graphics deliver cost advantages through one-time investment versus recurring expenses. A wrap costing $0.15-$0.48 per thousand impressions with 5-7 year lifespan creates annual costs of $500-$1,200, while equivalent digital advertising requires $12,000+ yearly with zero residual value. The compounding familiarity effect in local markets amplifies value over time, while digital ads generate constant-value impressions requiring continuous spending to maintain presence.
When is the optimal time to invest in fleet graphics?
Optimal timing aligns with four readiness signals: brand maturity after finalizing visual identity elements, fleet lifecycle synchronization when acquiring new vehicles or post-refresh, market expansion phases entering new territories or scaling operations, and favorable economic conditions supporting growth investment. Premature investment before brand stabilization multiplies costs through early replacement needs, while delayed investment wastes accumulation time for building local market familiarity.
How can businesses measure ROI from vehicle graphics without direct attribution?
Proxy metrics capture value when direct attribution proves impossible. Geographic cohort analysis comparing customer acquisition costs between high-exposure and low-exposure zones isolates impact. Sales cycle compression measurement for prospects familiar with branding reveals conversion efficiency gains. Lead source mix evolution tracking self-generated inquiries versus paid channels demonstrates growing brand pull. Pricing sensitivity testing across territories reveals familiarity-driven pricing power advantages that often exceed direct lead generation value.